PHP FTP Client class (New)
Read more at https://www.phpclasses.org/package/12196-PHP-Send-and-receive-files-from-a-FTP-server.html
There are plenty of JavaScript libraries out there for rendering your otherwise plain and boring numerical data into beautiful, interactive, and informative visualizations. The beauty of using JavaScript for data visualization is that, if created correctly, your data will be highly accessible (usually via HTML tables). A long time ago (2008), I wrote about JavaScript solutions for graphing and charting data and this article revisits the topic with twenty more JavaScript libraries that you can use to bring your data to life, all for no cost.
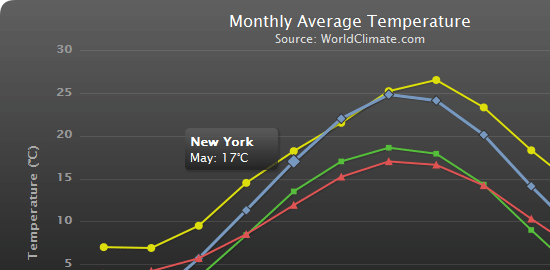
Highcharts is one of the most promising JavaScript charting libraries to hit the scene recently, with its large array of features including seven charting types (line, pie, and bar among them), the ability to zoom in and out of charts, and tooltips for offering more information about data points. The library has many options for customization and they’re well documented on one page for easy referencing.
gRaphaël is a charting library based on Raphaël, a vector graphics drawing JavaScript library. The library is divided into sub-libraries so that you can just download the type of chart that you’re interesting in creating. With the main library, g.raphael.js, at only 12KB and sub-libraries between 4KB to 8KB, this can be a lightweight but fully featured JavaScript charting solution for web developers.
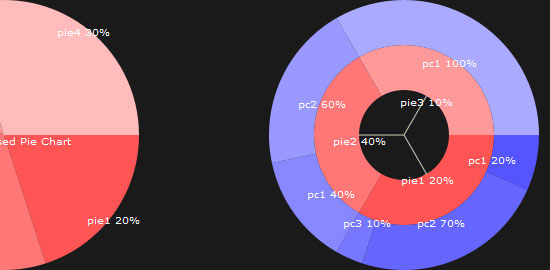
JavaScript InfoVis, a charting library influenced partly by MooTools, is a robust and excellent solution for data visualization. It’s modular (just like MooTools) so that you can include just the parts you need to keep your pages light. It has animation effects capability to captivate and engage your users, plenty of charting types, a helper class for working with JSON data, and much more.

If you’re already using jQuery, it’d be performance conscious of you to look into plugins for your visualization requirements. jQuery Visualize, a plugin developed by the Filament Group (the core developers of jQuery UI), is a jQuery plugin for generating charts using HTML5’s canvas element. It has 14 options for customizing your charts. Don’t forget to try out their Configurable demo.
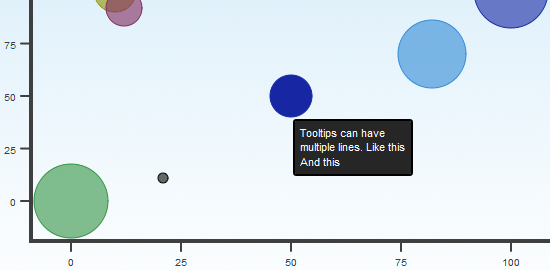
For now, moochart only plots bubble diagrams, but there are plans to expand this MooTools 1.2 plugin to feature pie, line, and bar graphs. The plugin has 14 options that you can use for customizing your diagram’s look, and tooltips for providing more information about a bubble when mousing over them. moochart is open source and released under the MIT license.
JS Charts boasts easy usage by emphasizing on the end-user’s ability to use the library with little to no coding, making it ideal for web designers who’d like to chart data without spending too much time learning how to write JavaScript. JS Charts has a web-based GUI and offers hosting for your charts to take some load off your own servers. It supports three chart types: bar, pie, and line.
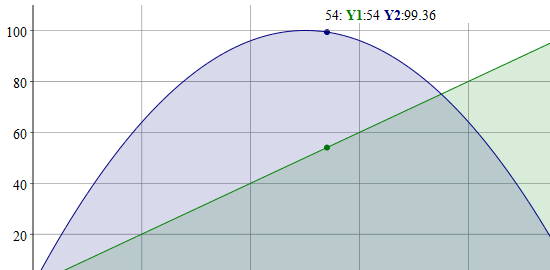
dygraphs is a JavaScript visualization library for producing interactive charts for time series data. It was designed to plot dense data sets (such as temperature fluctuations). It has user interfacing options such giving the user the ability to specify time intervals on the fly, displaying of values when mousing over parts of the chart, and zooming. It also integrates with the Google Visualization API.
JSXGraph, developed at the University of Bayreuth in Germany, is a standalone JavaScript library for plotting complex geometric shapes and data such as Bezier curves, differential equations, and much more. It has animation features for moving graphs, interactive components such as sliders for experimenting with changing values of variables, and plenty of charting types to choose from.
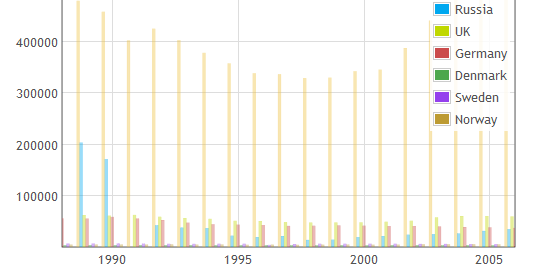
Protochart is a JavaScript library for use with the Prototype JS framework. It uses HTML5’s canvas for modern browsers, and the ExCanvas library for Internet Explorer support. It has six types of charts including line, pie, bars, points, lines with points, and area graphs. It allows for the display of legends that are highly configurable to help identify items on your charts.
Bluff is a lightweight charting library that ports Ruby’s Gruff gem to JavaScript. Weighing at only 11KB gzip’ed (you also need JS.Class which only weighs 2.6KB gzip’ed), it’s surprising that you’ll be able to get 15 different types of charts out of this library. It features tooltips, a ton of configurable options, legend support, and the .set_theme method for declaring reusable themes.
Style Chart is a free JavaScript-based charting web service/API for creating hosted charts. It’s also available as a downloadable library in case you want to host your own charts (though you need to register in order to download it). It has the things you’d expect from a robust and configurable charting library such as tooltips, legends, and 19 types of charts including 3D pie, 3D bar graphs and Pareto charts.
jqPlot is another jQuery plugin for data visualization developed by Chris Leonello. It’s open source, embodying two sets of licensing: MIT and GPL version 2. It has many options for you to take advantage of in order to truly customize your charts.
jQuery Sparklines is a simple and lightweight jQuery plugin for charting dynamic sparklines (a condensed data graphic). It emphasizes on ease of use and minimal coding; you can create complex sparklines with as little as one line of JavaScript code. When minified and gzip’ed, the plugin only weights 4.7KB so it won’t bog down your page response times much.
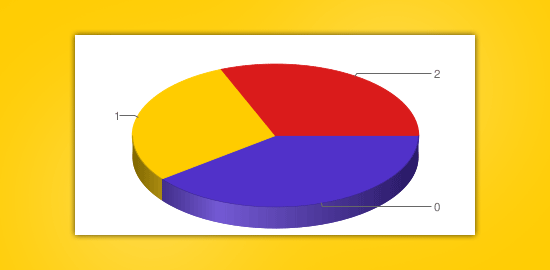
jQuery Google Charts (abbreviated as jGCharts), developed by Massimiliano Balestrieri, is a data visualization jQuery plugin for working with the Google Charts API. It has plenty of chart types, including a 3D pie chart that’s dynamically generated. It has a GUI in development (still in alpha release), which will allow you to create charts easily with a graphical front-end.
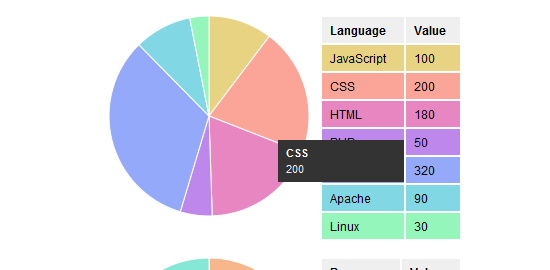
This MooTools class/plugin is for plotting pie charts using the canvas element. It’s based on Canvas pie by Stoyan Stefanov. It’s a simple and straightforward data visualization option for MooTools developers who are only interested in plotting out pie charts.
TufteGraph is a jQuery plugin that emphasizes on ease of use and minimalism. It offers you only a few options for styling and instead relies on CSS for customizing the look and feel of your graphs, which ultimately means that your web pages will render faster because JS has to work less. Check out this introduction video to TufteGraph.

Timeline is a JavaScript widget for creating interactive timelines. You can scroll through items featured in chronological order by using your mousewheel or by holding down your mouse button on the timeline and dragging left or right. Clicking on a dot, which represents an item in the time line, will reveal more information. Timeline is open source, released under the BSD license.
Protovis is a data visualization library for charting data. Protovis was created by the Stanford Visualization Group. It uses JavaScript and SVG to dynamically plot out your data. Protovis is open source released under the BSD license. You can download the source on their home page.
milkchart is a JavaScript charting/graphing library that requires MooTools. milkchart renders HTML data tables into one of its five types of charts: column, bar, line, scatter, and pie (with future expansions planned for area graphs) using HTML5’s Canvas element. milkchart is open source under the Apache License.
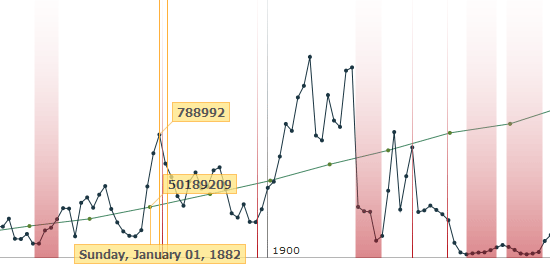
Timeplot allows you to dynamically generate time series graphs. Hovering over data points reveals their value. Timeplot was developed as part of the SIMILE Project at MIT. Here’s a step-by-step tutorial on how to utilize Timeplot. Timeplot is open source and available the BSD license. The Timeplot demo and download links are on this page.
Bringing data to life is an important part of web design. Javascript is great for any site with lots of data on it, such as a financial advisor or realtor’s website. It allows the data tables to stand out and not be so bland, so I highly recommend taking advantage of it.
The post 20 Fresh JavaScript Data Visualization Libraries appeared first on WebFX Blog.
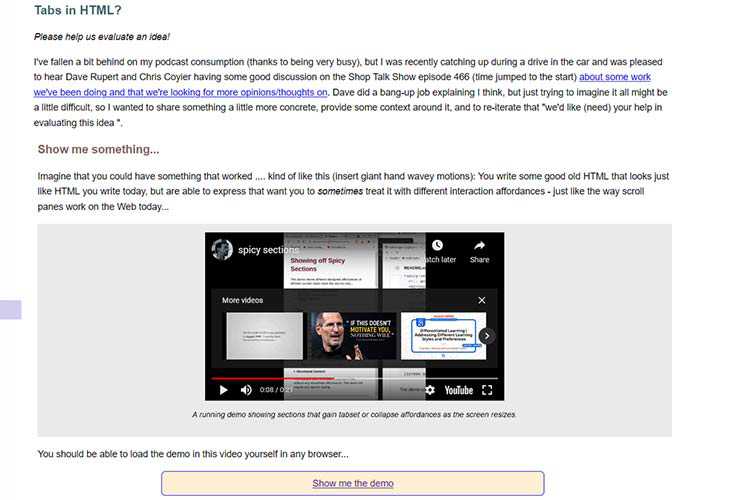
Tabs in HTML? – Check out this demo of HTML tabs that work differently, depending on viewport size. Could this be the future of HTML?
Manim – Create precise animations programmatically with this engine for explanatory math videos.
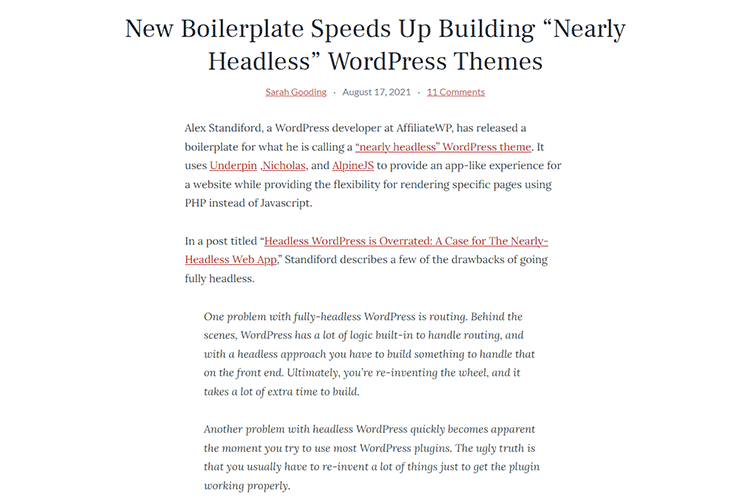
New Boilerplate Speeds Up Building “Nearly Headless” WordPress Themes – A look at why it might be more efficient to go with a configuration that stops short of being “headless”.
Novus – A multi-threaded package manager for Windows that promises speed.
The Grumpy Designer’s Cure for Massive Expectations – Why attempting to be a knower of all things is a road to nowhere.

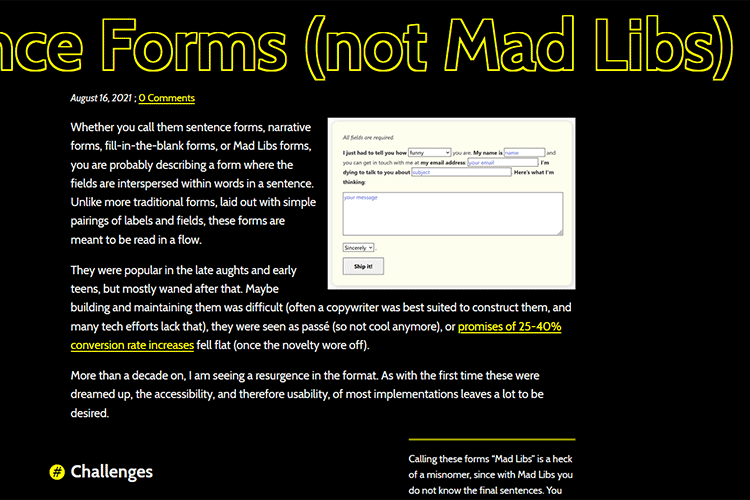
Sentence Forms (not Mad Libs) – The challenges in building HTML forms that feature fields interspersed within content.
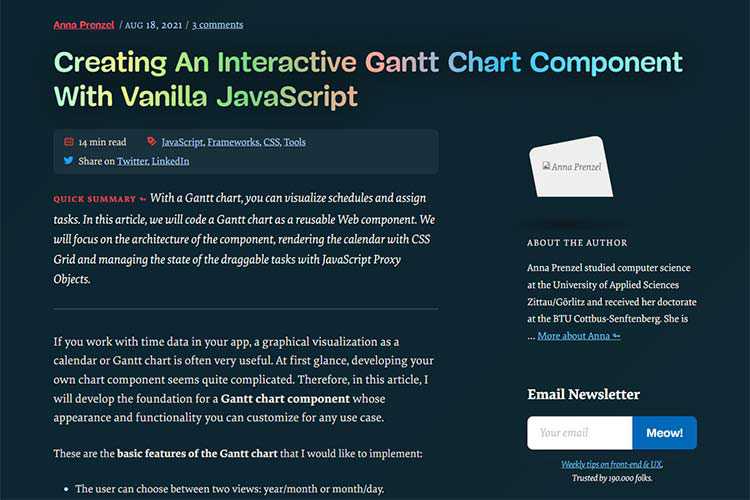
Creating An Interactive Gantt Chart Component With Vanilla JavaScript – Learn the secrets behind building your own Gantt chart.
Create an Abstract Image Slideshow with OGL, GLSL, and GSAP – Learn how to create a WebGL-powered image slideshow animated using a single value.

Many Plugins, Many Styles: Creating a Consistent User Experience with WordPress – A look at how to deal with WordPress plugin CSS that clashes with your site’s design.

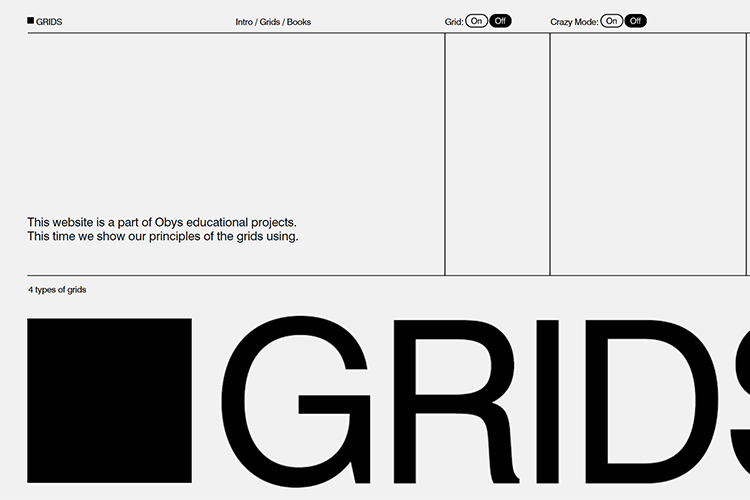
Grids – Explore the principles behind grid-based layouts.
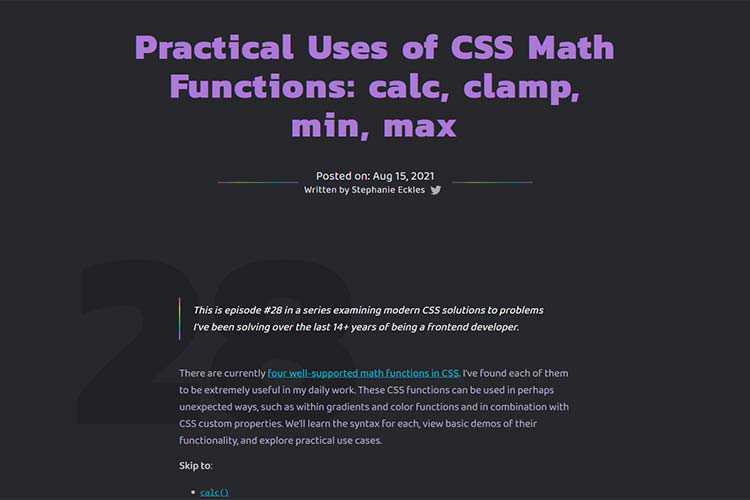
Practical Uses of CSS Math Functions: calc, clamp, min, max – Examples of how math functions can come in handy.
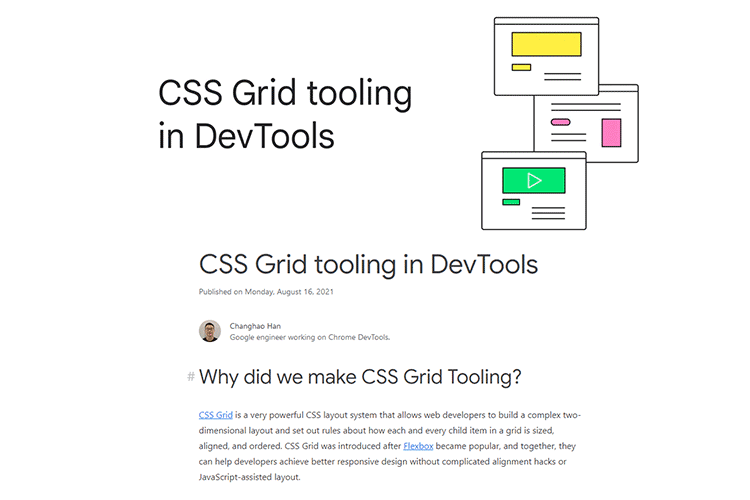
CSS Grid tooling in DevTools – Use Google Chrome’s DevTools to better understand and troubleshoot CSS Grid layouts.
The 40 Best Free Lightroom Presets in 2021 – Make quick work of your image processing with these free Adobe Lightroom presets.

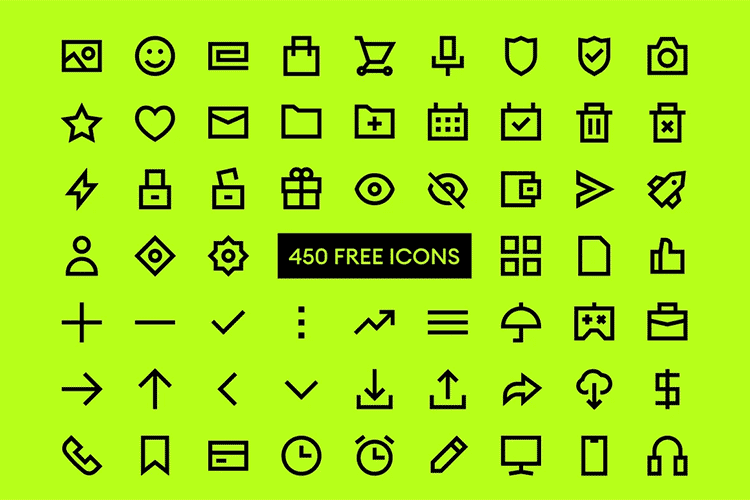
Edge – Grab this set of free outline icons available in three distinct styles.
Free New Zealand Mobile & Desktop Lightroom Presets – Add soft moody, warm, teal and subtle toning in your photographs with just a few clicks.

Ten Years of Bootstrap – A brief look at the numbers behind Twitter’s popular CSS framework.

The Role Design Plays in Your Client’s Sales Funnel – What you’re really supposed to be doing as a designer.

INSTAD.IO – A tool for quickly turning your images into hand-drawn like illustrations.
The post Weekly News for Designers № 607 appeared first on Speckyboy Design Magazine.
365psd consistently publishes high-quality PSD files for you to download. Whether you’re looking for specific user-interface components like web buttons or entire UI kits, you’ll find it on this community-driven site.
Brusheezy is a premier resource and community site for artists seeking to find user-contributed free PSD resources. Though they’re most known for their Photoshop brush libraries, they have also have a huge collection of over 300 free PSDs.
Web designer Orman Clark is the creator of Premium Pixels, a top online destination for those in search of cream-of-the-crop, free design resources. You’ll find a big range of free PSDS on this site, like the Dark UI Kit (PSD) and even this 13-inch Apple MacBook Air PSD.
You probably know of Dribbble already, an exclusive site for designers where we can share screenshots of our work. But did you know that you can find a lot of PSDs on Dribbble? A simple search using terms like “psd” and “free psds” will lead you to a ton of high-quality PSDS.
Freepik, a search engine that helps graphic and web designers locate high-quality graphics, has a special section that indexes all the free PSD files they have on the site. Having served over 91 million downloads and having indexed over 1.4 million design resources — there’s a good chance you’ll find what you’re looking for at the site.
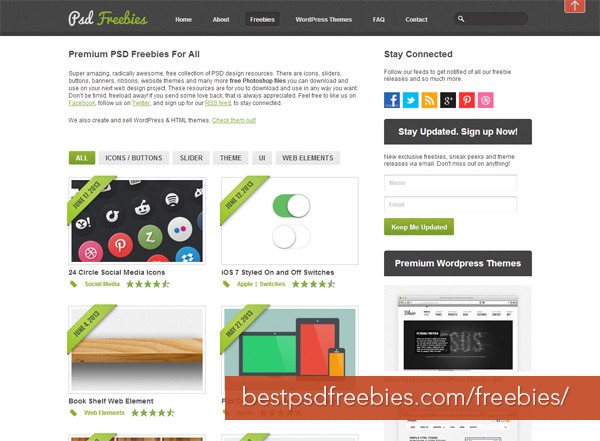
Best PSD Freebies is a website where you can discover free PSD design resources. It’s by Canadian web designer Michael Reimer, whom I’ve had the pleasure of working with through our partner site, Six Revisions.
![]()
What PixelBin lacks in the quantity of PSD freebies they’re offering (relative to the other sites on this list) the site more than makes up for in terms of quality. Though they only have around 30 free resources, they’ve already served 88,000+ downloads — a testament to the goodness of their PSDs.
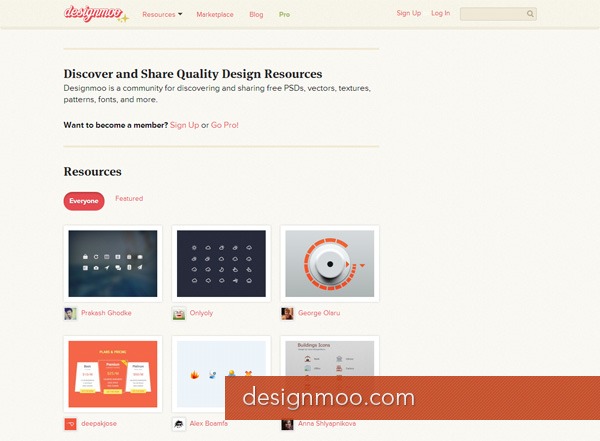
Though Designmoo doesn’t strictly dish out free PSD files, it’s hard to write an article like this without mentioning this design resource site for two reasons. First is that Designmoo offers superior-quality design resources. Secondly, among the different types of user-contributed design resources they make available for free, many of them are PSDs.
This site collects and features hundreds of free Photoshop files that the sites owners have found on the Internet. Right now, they’ve steadily amassed a collection of over 200 free Photoshop files.
This site has a wonderful hoard of free PSD files — templates, icon sets, UI sets, graphics, you name it, they have it. What I like about this site is that the PSD previews are nice and large, making it easy to spot the freebies I’m looking for.
Also: I just wanted to mention that Design Instruct occasionally releases free PSD downloads as well — feel free to download them!
What’s your favorite site for finding PSDs, and why is it your favorite site? Please share your thoughts in the comments below. Thanks!

The post 10 Best Websites for Downloading Free PSD Files appeared first on WebFX Blog.
Before the release of WordPress 5.0 in 2018, the Classic Editor plugin was published to help ease the transition to the new block editor. At the time, we promised to support the plugin through 2021 and adjust if needed as the deadline got closer. After discussing this with Matt, it’s clear that continuing to support the plugin through 2022 is the right call for the project as well as the community.
Still, if you’ve been putting off using the block editor, this is an excellent time to give it another shot. Since it first appeared in 2018, hundreds of WordPress contributors have made a lot of updates based on user feedback. You will be pleasantly surprised at how far it’s come!
Big thanks to everyone who has been working on WordPress, Gutenberg, and the Classic Editor plugin. And thank you to every WordPress user and tester who has provided the feedback we need to make the software even better.
~ Josepha
Returning to the block editor for the first time in a long time? You can give feedback early in the process by joining the outreach program! Looking at it for the first time ever? Get your bearings with some workshops or check out this demo!
Latest PECL Releases: