Interview with Kim Cottrell
Show Notes
Audio
This episode is sponsored by
Ring Central Developers
The post Interview with Kim Cottrell appeared first on Voices of the ElePHPant.
The post Interview with Kim Cottrell appeared first on Voices of the ElePHPant.
Every website project has its own distinct needs. Sometimes, the look and functionality really do need to be built from the ground up. In other scenarios, time is of the essence and there simply isn’t enough of it to go fully-custom.
WordPress and its community provide us with solutions for both. The CMS itself offers a Theme Handbook that can guide developers through the ins and outs of building a custom theme. On the other end of the spectrum, there are thousands of free and commercial readymade WordPress themes available.
Today, we’re going to break down the pros, cons and use cases for each path. While aimed at those who are new(ish) to WordPress, it can also be a handy resource for those who tend to stick with one solution over the other. It never hurts to think about what else is out there. Let’s begin!

Without a doubt, building a WordPress theme from scratch is a longer process – not to mention one that requires knowledge of CSS, JavaScript and PHP. That in itself means that non-coders may be left behind.
That being said, it’s also an incredible opportunity to learn. Beyond the aforementioned handbook, there are tons of resources available for aspiring theme developers.
In addition, there are some outstanding starter themes available that give you a leg up on your projects. The advantage here is that you can customize a starter theme to include commonly-used scripts, layouts and styles – allowing you to craft a repeatable workflow.
The appeal of a readymade theme is that, in theory, it does all the heavy lifting for you. Just customize the fonts and colors, add a logo, fill in your content and – boom! You have a fully-functioning WordPress website.
However, the reality isn’t so cut-and-dry. Unless you’re willing to go with a fully-default setup, there could be a lot of extra work required to customize things to meet your needs.
Winner: Readymade Themes are still the way to go if you want a lower barrier to entry. You can pick up, fill in the details and be done with it.

A lot of free and commercial themes emphasize how easy they are to customize – and they’re spot on, to a point. Whether through an options panel or the native WordPress Customizer, there can be a whole lot of things to tweak.
Still, there’s only so much you can do through a panel alone. That’s why a lot of theme authors also bundle in a page builder plugin. That allows for custom layouts and other goodies. However, it also means that you have to keep the plugin enabled to maintain what you’ve built.
Building a custom theme offers the ultimate level of control. The layout and styles are whatever you want to make them – an unlimited array of possibilities. If you’re looking for a more visual process, the Gutenberg block editor offers the ability to create content area layouts without the need for an additional plugin.
It’s also possible to create distinct page templates, add custom JavaScript and conditional content. You’re only limited by your coding skills and imagination.
Winner: Custom Themes, for allowing complete control.

This one gets a bit tricky. It is entirely possible that both a custom or readymade theme could have issues down the road. The difference in which is the better bet may again come down to control.
Utilizing a theme built by someone else inevitably means you’re relying on them for maintenance. They are responsible for fixing bugs and security holes. Any new features will come from them as well.
There is some risk associated with this. For example, it’s possible that a theme update causes issues for your particular website (even if you’re using the recommended child theme). And, what happens if the author no longer maintains the theme? You might be forced into a tough situation.
For some developers, having the final say over how a theme has been built means a lot. You know what you did and how you did it. The theme structure makes sense – even if only to you. If something goes wrong, you can go in and (hopefully) squash any bugs.
Finally, there is reason to wonder where the all-in-one commercial theme market is headed. With the block editor potentially being able to handle full-site design at some point, the current approach may not be around in a few years.
Winner: Custom Themes, and the intimate knowledge their developers have of them. Plus, self-reliance is a beautiful thing.

For web designers and developers, the choice of whether to go with a readymade WordPress theme or build one from scratch often comes down to two factors: time and budget.
A project that needs to be built in a hurry and for little money favors a readymade theme. The convenience of a well-made product can help you get things done quicker and cheaper.
But one size does not fit all. Thus, when the budget and timeline are in your favor, custom is often the better option. A custom WordPress theme puts you in control and allows you to build to the exact specifications of your project.
This is not only good for you; it also benefits your clients. They’ll have a website that includes just what they need – without a ton of unnecessary bloat. If built by a talented developer, a custom theme will also be simpler to use and maintain. Not to mention that it can be built to keep curious clients away from the design itself.
Still, either path is a viable one. But it makes sense to think about the pros and cons before making a final decision.
The post WordPress Theme Showdown: Custom Built vs. Readymade appeared first on Speckyboy Design Magazine.
We web designers have always been a crafty bunch. If there’s a specific look or functionality we need to achieve, we can usually piece together a solution. That’s the case even when there isn’t a specific standard or tool to guide us. This is where the concept of the web design hack comes into play.
Hacks are creative, often roundabout methods for making a website look or work in a certain way. Sometimes, they carry a negative connotation. For example, HTML table-based layouts were rightfully derided as not being accessible to screen readers. But not all hacks are bad.
Indeed, they are deployed out of a need to push the envelope of what is possible. The web has always had its limitations and designers have used hacks to try and get around them.
With that, let’s take a look at some of the most useful and prevalent web design hacks from years gone by, as inspired by a Twitter discussion with fellow designers. While they don’t necessarily hold a candle to the standards we have today, they were hall of famers in their own time.
Our first selections will go into this virtual hall of fame together. Although their respective peak usage were years apart, they were essentially used to accomplish the same thing: multicolumn layouts.
Before CSS arrived on the scene, early webpages were a single-column affair. There was no padding or margins, and no standard way to place content in horizontal columns. That is, until some enterprising soul decided to use tables for this purpose.
Of course, HTML tables were meant to hold tabular data – not page layouts. But they were actually an effective way to get the job done until CSS came along.
Tables had many drawbacks – the aforementioned accessibility issues included. They also were slow to render in the browser. So, when CSS floats were introduced, it was seen as a game changer for web designers.
Floats weren’t HTML markup, and so they were more accessible and could increase performance. All of the sudden, multicolumn layouts were possible through CSS and could better adapt to things like screen size.
However, floats didn’t get us all the way to the promised land. If you wanted columns to be of equal height, an additional clearfix hack had to be implemented.
Each of these items are also still very useful today when used for their originally-intended purpose. But for layouts, their days are thankfully done.

) and Spacer.gifDetail-oriented web designers have often looked for ways to space elements down to the exact pixel. Again, this wasn’t so easy back in the day. Thus, the non-breaking space ( ) and spacer.gif were used to gain more control over spacing.
)Want to bump an element over horizontally, but without centering or right-aligning it? Adding a few non-breaking spaces would do the trick.
However, it wasn’t such an exact science. The actual size of each space depended upon the font family and font size. And even accounting for those differences, this hack could still look differently depending on the browser and OS a visitor was using.
This more accurate spacing hack came through creating a transparent .GIF image (often named spacer.gif) and placing it into a page. The neat aspect was that, because it’s a transparent image, designers could set the height and width to any pixel amount without negative impacts on look or performance.
CSS rendered both of these hacks obsolete. But wouldn’t you know it that the WordPress Gutenberg editor has a Spacer block that does pretty much the same thing? It just goes to show that the need is still there.

The need for this one was pretty simple. The early web was essentially limited to fonts installed on the user’s system. Of course, designers had no way of knowing all the fonts that users had access to – other than the basics like Times New Roman, Georgia, Arial and Helvetica.
With that came the kind-of awful decision to create images full of text in Photoshop. While this allowed for the use of virtually any font, it came at the expense of accessibility. In addition, using an image in place of an HTML heading tag also threw off the semantics of the page – potentially damaging SEO.

HTML frames were perhaps ahead of their time, as many of the tasks we once used them for are now done through CSS and JavaScript.
The concept was fairly simple. Each individual “frame” within a layout was actually its own page. This was an easy way to separate a header, footer or navigation from the rest of the site’s content. Making a change to the navigation, for example, meant a single change in a single file. It’s similar to what server-side includes did, only with some other design benefits included.
Chief among them was the ability to create “sticky” headers and navigation. As the user scrolled through content, they could still easily navigate through the site.
This technique served its purpose, but it was far from ideal. It wasn’t very adaptable in terms of different screen sizes and wasn’t so great for SEO, either. There were also some security concerns about potentially loading a frame from a nefarious URL.

In the days before the widespread availability of broadband, image optimization was vital. Even a 50kb image could weigh a page down over a slow connection.
Software giant Adobe provided an interesting solution. With their ImageReady software, designers could slice up a single image into any number of smaller pieces. Each individual slice could then be optimized, theoretically making them quick to download.
But that’s not all. The software could then export the slices into an HTML table. From there, you could copy and paste that HTML into your page.
The problem with this technique was two-fold. First, the table layout could take extra time to render – potentially killing any optimization you had achieved. Second, it could be a real pain to maintain. Adding a navigation item to a large header graphic, for instance, might require starting over with a whole new set of slices – thus requiring template changes.
While image optimization is still important, broadband thankfully allows us a little more leeway with big files. Even so, modern versions of Photoshop still offer image slicing and HTML export.

<!--[if IE]>To this day, it’s still not unusual to hear web designers (myself included) curse the dogged existence of Internet Explorer. Its legacy lives on, in part because some users simply won’t give it up.
Because of that, it forever seems like we’re hacking our way around IE’s many proprietary quirks and limitations. For many years, that included using a conditional comment to detect IE users and serve up alternate styles.
It was somewhat versatile in that you could apply styles to all versions of IE <!--[if IE]>, or target those using older versions <!--[if lt IE 11]>. You might also use it in reverse, looking for versions greater-than or equal to a specific release <!--[if gte IE 10]>.
Microsoft must have had some sympathy for web designers, as it enabled these conditional comments to work in IE. Thankfully, their new Edge browser doesn’t require such nonsense.

The hacks in our hall of fame certainly weren’t the only ones used by web designers. There are untold numbers of workarounds that helped us do the seemingly-impossible. But what sets this list apart is their massive usage and, in some cases, support from major corporations.
And perhaps the best thing we could say about them is that they worked. We used them as a means to an end. Sure, they may have been held together by fraying duct tape, but getting that high-minded design to actually render in a browser felt like a real achievement.
Even better is that they helped to pave the way for what the web is today. Most of the items on this list have been replaced by HTML and CSS standards, which benefit everyone.
The post The Web Design Hack Hall of Fame appeared first on Speckyboy Design Magazine.
You want to make a positive first impression with new visitors. When they come to your site, you want them to take an interest in your products or services and become a customer.
If your website isn’t up to par, though, you risk setting a negative first impression with your audience because 94% of first impressions relate to your website’s design.
Not only does your site’s design make the first impression, but it has the power to determine if someone becomes a sale for your business.
How can web design improve sales?
Keep reading to learn more about how revamping your site’s design can help increase your business’s revenue!
P.S. If you want to stay up to date on the latest marketing trends and get actionable tips for using web design and marketing to increase your bottom line, subscribe to Revenue Weekly!
Web design has the power to help you increase sales and improve your company’s revenue. How can web design improve sales exactly?
Let’s look at a few statistics that show the impact of design on sales:
When users look at your site, they determine if you’re credible based on your design. So, if your current design is outdated, visitors won’t see you as trustworthy and will shy away from your site. That causes you to miss out on sales for your business.
When you revamp your website’s design, you improve your site’s credibility. A clean and modern website will make visitors feel comfortable browsing or shopping on your page. As a result, they’re more likely to purchase from your business.
Improving your website’s design can boost its credibility, which will lead to increased sales for your company.
Want to know how web design can improve sales?
Start by looking at how your website’s design affects the user’s experience.
If your site is outdated and difficult to use, your visitors won’t remain on it. They will leave your site and visit a competitor’s website, resulting in a lost sale.
A website that delivers a positive experience with great design, however, keeps people engaged on your site. Not only will you draw them in with a visually appealing site, but you will have a website that’s functional and easy for your audience to use.
This improved design will lead to more engagement and sales for your business.
If your website isn’t visually appealing, people will stop engaging with it.
Your audience wants to interact with sites that are visually appealing and catch their attention. An outdated website can cause people to leave, which means they won’t turn into a sale for your company.
By investing in professional web design, though, you can drive more sales and revenue for your business. You can create a more visually appealing site that catches your audience’s attention and gets them to engage with your content.
We don't just want to tell you about the beautiful work we do. WE WANT TO SHOW YOU We've built over WEBSITES IN INDUSTRIES LIKE YOURS
You have an answer to the question “How can web design improve sales?” and know the importance of web design for sales, so now it’s time to move on to how you can improve your site’s design to drive more sales.
When you know the importance of web design for sales, you can understand the impact of having a functional site that appeals to your audience. The first step to increasing sales is integrating responsive design.
Responsive design ensures your site adapts to whatever device someone uses.
If someone accesses your website on their mobile device, responsive design ensures that your site adapts to fit the smaller screen. Users will have the same great experience that they would if they accessed your site on a desktop.
You must integrate responsive design into your site because 37% of consumers are more likely to buy from mobile responsive websites. A good website design that’s responsive can help you increase sales for your business.
If you want to increase sales with web design, focus on your calls to action.
When your audience likes the information on your site and wants to take the next step, they look for CTAs to guide them. If your CTAs don’t stand out on the page or tell your audience how to proceed, you’ll miss out on sales for your business.
You can increase sales with web design by creating CTAs that pop off your page.
Look at this example from Apple:

The blue CTA pops off the page’s white design. It’s also descriptive and tells the user exactly what happens if they click on the CTA. In this case, if someone clicks on the CTA, they will add the product to their bag.
When you have a good website design, your CTAs will stand out on the page and provide a thorough description of what happens when they click the button. So instead of having a CTA that says, “Click here,” you want a descriptive CTA like, “Click here to sign up for your free trial!”
So, how can web design improve sales?
Well, by designing CTAs that engage your audience and are easy to find, you’ll get more people to click on them, which will lead to more sales for your business.
If you want to increase sales with web design, focus on using high-quality visuals.
Visuals play a critical role in keeping your audience engaged on your page.
When you have blocks of text on your page and nothing to break them up, you risk pushing your audience away from engaging with your site. Walls of text can feel overwhelming, which causes users to bounce from your website.
Additionally, if your visuals, like for product images, aren’t high quality, your audience won’t be able to see them. It will also give them a bad impression of your site and can make visitors perceive your website as untrustworthy.
Good website design includes high-quality visuals that help enhance the user experience. You can use photos, videos, or graphics to add a visual pop to your site.

You’ll want to use original visuals — stock photos or graphics can feel impersonal, and there’s a chance your audience may see them used on other sites.
Adding visuals to your website will help you keep leads engaged longer, which will lead to more sales for your company.
If you’re still asking, “How can web design improve sales?” it’s time to look at one of the most critical aspects of web design: Your navigation. When you invest in web design, focus on building an organized navigation that’s easy to use.
With organized navigation, people can find your products or services faster and easier, making them more likely to become a sale for your business.
Take Apple as an example.
Their navigation is organized by the products they sell. They have separate categories for their computers, iPads, and iPhones, as well as watches and TVs.
![]()
This navigation makes it easy for shoppers to find the product they need.
When it comes to your navigation, you want to ensure you organize it so your audience can find relevant information. Use broad categories and organize related subcategories beneath them. It will help you create organized navigation so your audience can find information fast.
If you want to increase sales with web design, make sure you utilize white space.
Many companies make the mistake of trying to fill every inch of their website with information or visuals. The reality, however, is that overloading your site can make it more distracting and overwhelming for your audience.
White space is fundamental to good design. It enables you to have a clean site and keep your audience focused on crucial information.
Apple’s website is an excellent example of utilizing white space to keep visitors focused.

When you use white space, you keep your audience focused on the vital information and get them to stay engaged on your site longer. Longer engagement time leads to an increase in sales for your business.
Did you know that slow-loading sites cause $2.6 billion in lost revenue annually?
If your site doesn’t load quickly, you’ll miss out on sales for your business. But with web design, you can improve your site’s load time, and therefore, earn more sales for your company.
To see your site’s current load time, you can input your URL into Google PageSpeed Insights and see your site’s current load time. If your site isn’t up to par, you can take Google’s suggestions and try to improve your site to help it load faster.
You can also invest in page speed services from a digital marketing company if you don’t have the time or don’t know where to begin when it comes to improving your site’s design.
Investing in your website’s design will help you increase sales for your business. By creating a beautifully designed site, you’ll keep your audience engaged and interested on your page longer.
Revamping your site’s design can be a big project, but WebFX can take that task off your to-do list. With our award-winning team of over 200 experts, we can help you build a website you’ll love.
Contact us online or call us today at 888-601-5359 to speak with a strategist about our web design services!
The post How Can Web Design Improve Sales? [+5 Ways to Increase Sales with Web Design] appeared first on WebFX Blog.
You’ve got a video to produce, and the goal is clear: put your company or brand front-and-center.
Many promotional videos focus on building a brand. You’re competing with others for mindshare, the space you occupy in people’s memory. By using and promoting your logo, you can help to build awareness for your brand’s visual identity!
With the help of the best logo reveal effect templates, you can make a splash without learning After Effects animation from scratch. Her are three basic steps you can use to create a professional logo reveal in After Effects with less work than you thought was possible:
In this round-up, we’re going to check out 10 of the best templates that you can use to create a logo animation of your own.
In the business world, branding is everything. This template is built as a corporate-friendly logo reveal. Imagine combining this logo reveal template with a voiceover intro to unveil a new company or branding, for example.
The template has the hand-engraved feel of a 3D animation, but you don’t have to create that yourself. Just drop in your logo and watch the template magically work.
Download Elegant Corporate Logo V3
As the name implies, simple shapes come together to make a splash with your logo. It’s a fun and playful way to introduce your company logo.
You could use this template as the intro for a YouTube video or presentation to set the tone for an upbeat production. This logo reveal template works best with simple, line-shape logos.
Particles are a futuristic and sci-fi style effect. Capture that spirit perfectly with this logo reveal template. The style of this logo feels perfect for an epic mobile game.
WIth gritty textures and particle animations, it’s easy to picture this logo reveal as a trailer to build excitement. The Particles Logo Reveal template is flexible, making it simple to add your logo. This template requires the Trapcode Particular plugin.
Download Particles Logo Reveal
The best logo reveal templates cut to the chase. They show just enough of your company logo so that it sets the stage for a brand-focused video. In less than 30 seconds, the Elegant 3D Shatter effect creates an incredibly engaging logo reveal.
Logo reveal templates like this adapt easily to your logo in just a few steps. You won’t have to worry about re-animating a shatter with the help of an easy-to-customize template.
Download Elegant 3D Shatter Logo
This design includes multiple logo reveal effects inside one simple package. There are 5 dynamic effects, each of which animate your logo with a different style.
What they have in common is the unique ability to reveal your logo without distracting from the production. With the help of Streaks, bring your logo to life in a way that feels like a fireworks show.
Download Streaks Logo Sting Pack
Like ink in water, this animation is sure to make a stir. It’s a beautiful way to showcase your brand. But don’t think that you have to film a splash yourself! Instead, use the color controls and your logo file for a splashy logo animation.
Best of all, it’s quick and to the point so that you can focus on the content after the intro.
Download Whooshing Particles Logo Reveal
You’ve seen other logo reveal templates that include smoke and quick effects. But this effect is a great reminder of just how many options are out there to create a striking logo reveal. This template is just as easy to customize as any other in this round-up and is just waiting for your logo. Try out it to help you create a logo reveal in After Effects in less time than ever.
Download Quick Smoke Strike Logo
As you check out these logo reveal templates, don’t forget this key point: they work with your logo. The animations might feel like they’re totally custom, but templates give you flexibility. That means that you can update them with your own specifics.
This water splash template feels straight out of the ocean and is customizable. Talented designers make it easy to take the template and add your brand image to create an animation.
Here’s another choice for logo reveal templates that make a splash. Mixing particle effects with an underwater view, there’s no chance that your logo reveal will go unnoticed. Remember, After Effects logo reveal templates are surprisingly easy to use.
With just a few clicks, you can use this same animation with a logo of your choice. That makes it easy to create a brand-focused design while avoiding a complete crash course in Adobe After Effects.
This set of logo reveal effects is far from neutral. If you want to make a bang with your logo animation, this is the perfect template for you.
Smoky bombshells break apart with your logo hiding just behind the scenes! Use this Adobe After Effects template to explode onto the canvas while keeping your brand the center of attention.
If you aren’t a pro video producer, you’re faced with a decision before you start creating a video. Should you learn After Effects from the ground-up, or hand off the essentials to talented animators?
As you saw in this tutorial, our recommendation is definitely to leverage pre-built designs with the help of logo reveal templates. You start with a design, use the custom controls, and presto: your brand logo reveal comes to life. Source them from Envato Elements to keep costs low.
The post 10 Best Logo Reveal Templates for Adobe After Effects appeared first on Speckyboy Design Magazine.
The Types of Freelance Design Clients You Should Avoid – How to spot a bad client from a mile away.

Beginner’s Guide to WordPress Plugin Development – Follow this guide to learn the basics of building your own WordPress plugins.

Make me think! – Taking the right approach to UX design.

Irregular-shaped Links with Subgrid – Techniques for linking up card UIs that go beyond traditional borders.
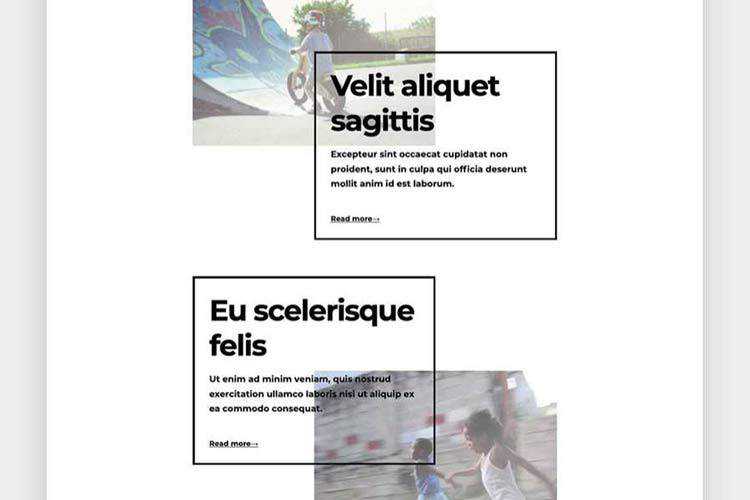
Creating a Menu Image Animation on Hover – Learn how to create a hover effect for a menu where images appear with an animation on each item.

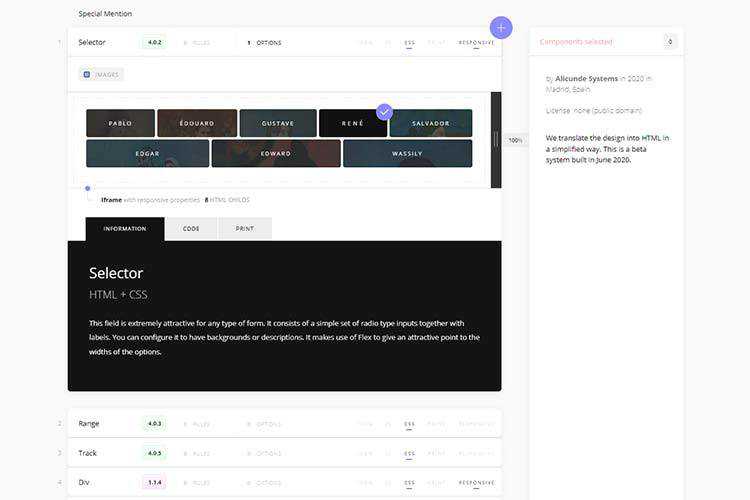
HTML – Simplified Code – A collection of design elements that outputs simplified code for your projects.
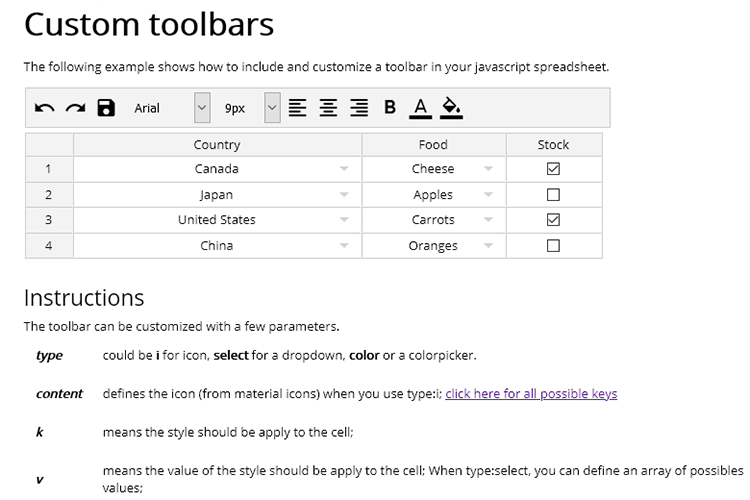
jExcel CE – A lightweight Vanilla JavaScript plugin to create amazing web-based interactive HTML tables and spreadsheets.
An Ode to Adobe Flash: How It Helped Move the Web Forward – As Flash fades into the past, its impact can still be felt.

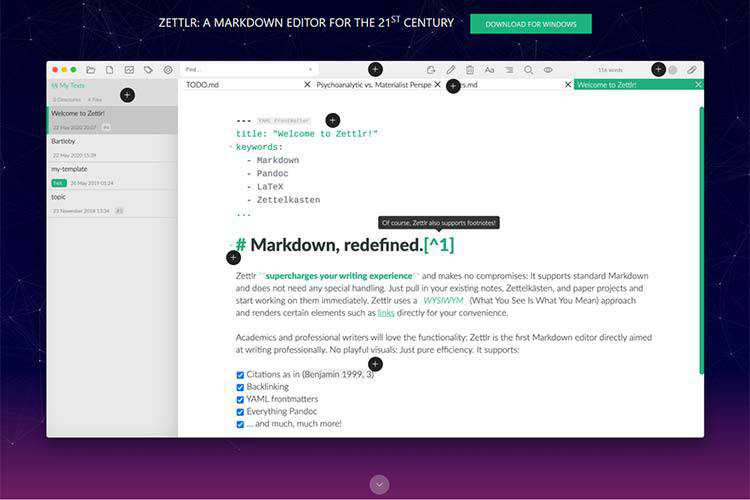
Zettlr – A free Markdown editor aimed at professional writers.
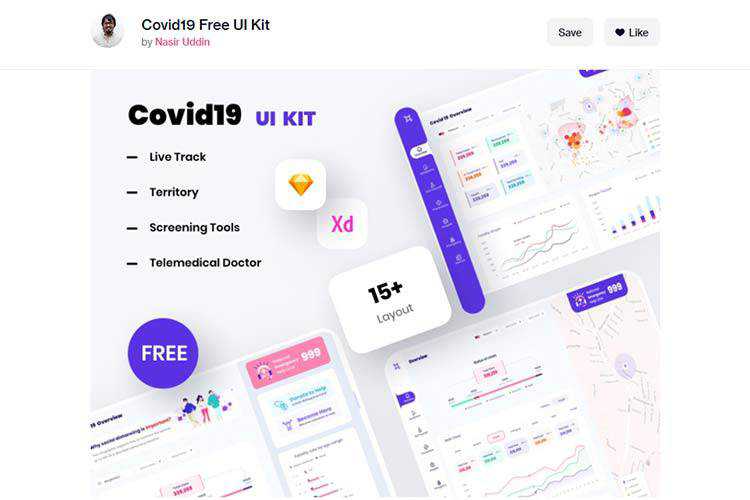
Covid19 Free UI Kit – A free set of UI elements and layouts for Sketch and Adobe XD.
Scroll to text fragment: How to link & highlight any text on a web page – Use this detailed guide to add text fragment highlighting to any page.

The 20 Best Free Outline Fonts – Add some unique style to your projects with these stunning fonts.

Accordion Rows in CSS Grid – Designer Eric Meyer details his use of CSS Grid on his website’s new layout.

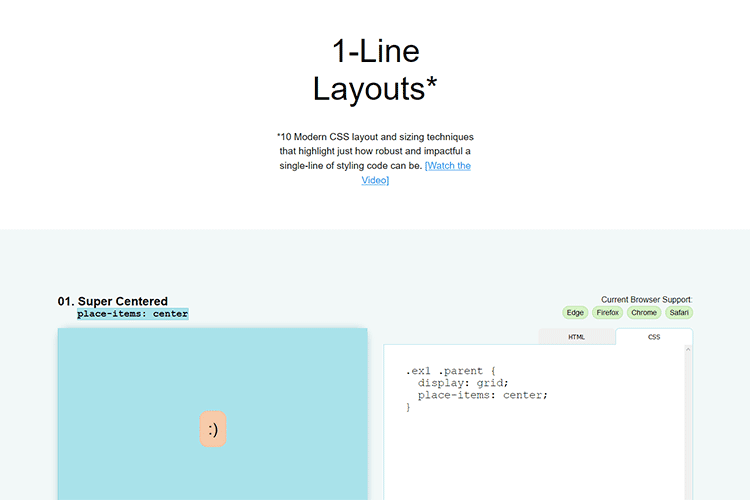
1-Line Layouts* – A collection of modern layouts and sizing techniques that demonstrate the power of CSS.
Flexbox Cheatsheet – A guide featuring 12 tips and tricks that every web developer should know.

harmonograph.art – A browser-based tool that lets you draw, download and share a randomized harmonograph.

The Chinese Type Archive – An on-going, collaborative, open-access index of Chinese typographic resources.

Profile Pro – Easily generate avatars with any background and use them with a simple download or a copy-paste.

Dark Ages of the Web – Notes on all the old-school techniques used by web designers back in the day.

The post Weekly News for Designers № 548 appeared first on Speckyboy Design Magazine.